Table of Contents
A network administrator should be able to use a sniffer like wireshark or tcpdump to troubleshoot network problems.
A student should often use a sniffer to learn about networking. This chapter introduces you to network sniffing.
This example shows how to install wireshark on .deb based distributions (including Debian, Mint, Xubuntu, and others).
root@debian8:~# apt-get install wireshark
Reading package lists... Done
Building dependency tree
Reading state information... Done
... (output truncated)
On .rpm based distributions like CentOS, RHEL and Fedora you can use yum to install wireshark.
[root@centos7 ~]# yum install wireshark
Loaded plugins: fastestmirror
Loading mirror speeds from cached hostfile
... (output truncated)When you start wireshark for the first time, you will need to select an interface. You will see a dialog box that looks similar to this one.
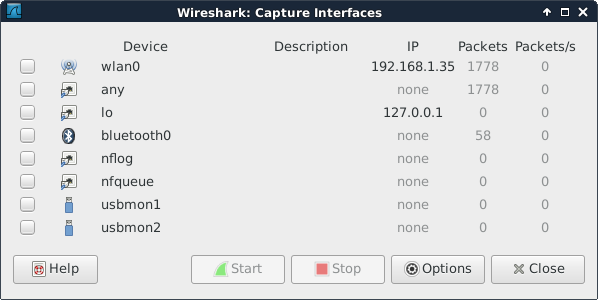
It is possible that there are no interfaces available because some distributions only allow root to sniff the network. You may need to use sudo wireshark.
Or you can follow the general advice to sniff using tcpdump or any other tool, and save the capture to a file. Any saved capture can be analyzed using wireshark at a later time.
Sniffing a network can generate many thousands of packets in a very short time. This can be overwhelming. Try to mitigate by isolating your sniffer on the network. Preferably sniff an isolated virtual network interface over which you control all traffic.
If you are at home to learn sniffing, then it could help to close all network programs on your computer, and disconnect other computers and devices like smartphones and tablets to minimize the traffic.
Even more important than this is the use of filters which will be discussed in this chapter.
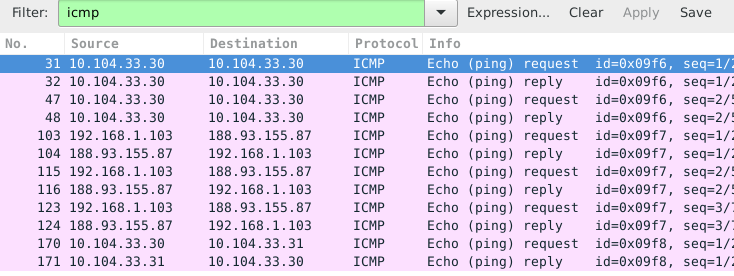
I started the sniffer and captured all packets while doing these three ping commands (there is no need for root to do this):
root@debian7:~# ping -c2 ns1.paul.local
PING ns1.paul.local (10.104.33.30) 56(84) bytes of data.
64 bytes from 10.104.33.30: icmp_req=1 ttl=64 time=0.010 ms
64 bytes from 10.104.33.30: icmp_req=2 ttl=64 time=0.023 ms

--- ns1.paul.local ping statistics ---
2 packets transmitted, 2 received, 0% packet loss, time 1001ms
rtt min/avg/max/mdev = 0.010/0.016/0.023/0.007 ms
root@debian7:~# ping -c3 linux-training.be
PING linux-training.be (188.93.155.87) 56(84) bytes of data.
64 bytes from antares.ginsys.net (188.93.155.87): icmp_req=1 ttl=56 time=15.6 ms
64 bytes from antares.ginsys.net (188.93.155.87): icmp_req=2 ttl=56 time=17.8 ms
64 bytes from antares.ginsys.net (188.93.155.87): icmp_req=3 ttl=56 time=14.7 ms

--- linux-training.be ping statistics ---
3 packets transmitted, 3 received, 0% packet loss, time 2003ms
rtt min/avg/max/mdev = 14.756/16.110/17.881/1.309 ms
root@debian7:~# ping -c1 centos7.paul.local
PING centos7.paul.local (10.104.33.31) 56(84) bytes of data.
64 bytes from 10.104.33.31: icmp_req=1 ttl=64 time=0.590 ms

--- centos7.paul.local ping statistics ---
1 packets transmitted, 1 received, 0% packet loss, time 0ms
rtt min/avg/max/mdev = 0.590/0.590/0.590/0.000 ms
In total more than 200 packets were sniffed from the network. Things become clearer when you enter icmp in the filter field and press the apply button.
Using the same capture as before, but now with a different filter. We want to see both dns and icmp traffic, so we enter both in the filter field.
We put dns or icmp in the filter to achieve this. Putting dns and icmp would render nothing because there is no packet that matches both protocols.
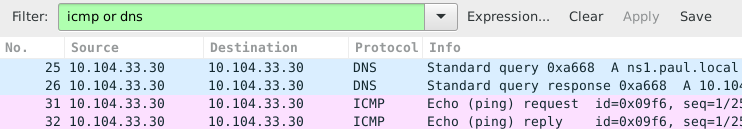
In the screenshot above you can see that packets 25 and 26 both have 10.104.33.30 as source and destination ip address. That is because the dns client is the same computer as the dns server.
The same is true for packets 31 and 32, since the machine is actually pinging itself.
This is a screenshot that filters for dns packets that contain a certain ip address. The filter in use is ip.addr==10.104.33.30 and dns. The and directive forces each displayed packet to match both conditions.
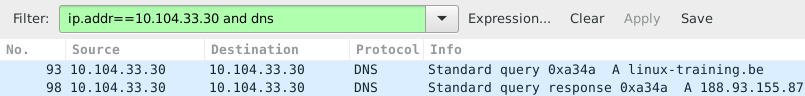
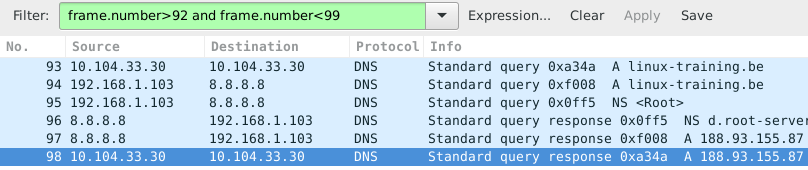
Packet 93 is the dns query for the A record of linux-training.be. Packet 98 is the response from the dns server. What do you think happened in the packets between 93 and 98 ? Try to answer this before reading on (it always helps to try to predict what you will see, and then checking your prediction).
The correct technical term for a packet as sniffed is a frame (because we sniff on layer two). So to display packets with certain numbers, we use frame.number in the filter.
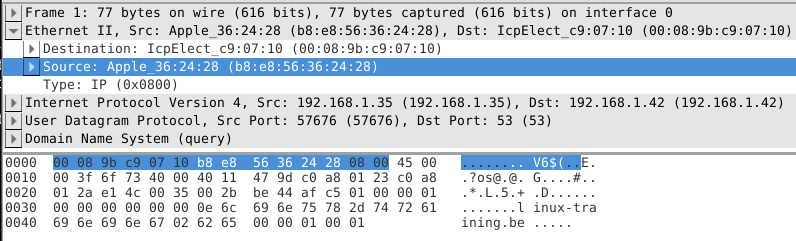
The middle pane can be expanded. When selecting a line in this pane, you can see the corresponding bytes in the frame in the bottom panel.
This screenshot shows the middle pane with the source address of my laptop selected.
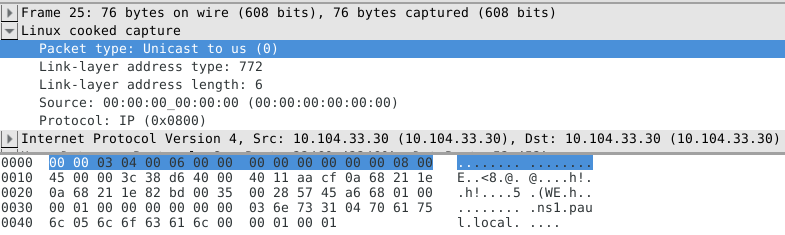
Note that the above works fine when sniffing one interface. When sniffing with for example tcpdump -i any you will end up with Linux cooked at this level.


Sniffing on the command line can be done with tcpdump. Here are some examples.
Using the tcpdump host $ip command displays all traffic with one host (192.168.1.38 in this example).
root@ubuntu910:~# tcpdump host 192.168.1.38
tcpdump: verbose output suppressed, use -v or -vv for full protocol decode
listening on eth0, link-type EN10MB (Ethernet), capture size 96 bytes
Capturing only ssh (tcp port 22) traffic can be done with tcpdump tcp port $port. This screenshot is cropped to 76 characters for readability in the pdf.
root@deb503:~# tcpdump tcp port 22
tcpdump: verbose output suppressed, use -v or -vv for full protocol decode
listening on eth1, link-type EN10MB (Ethernet), capture size 96 bytes
14:22:20.716313 IP deb503.local.37973 > rhel53.local.ssh: P 666050963:66605
14:22:20.719936 IP rhel53.local.ssh > deb503.local.37973: P 1:49(48) ack 48
14:22:20.720922 IP rhel53.local.ssh > deb503.local.37973: P 49:113(64) ack
14:22:20.721321 IP rhel53.local.ssh > deb503.local.37973: P 113:161(48) ack
14:22:20.721820 IP deb503.local.37973 > rhel53.local.ssh: . ack 161 win 200
14:22:20.722492 IP rhel53.local.ssh > deb503.local.37973: P 161:225(64) ack
14:22:20.760602 IP deb503.local.37973 > rhel53.local.ssh: . ack 225 win 200
14:22:23.108106 IP deb503.local.54424 > ubuntu910.local.ssh: P 467252637:46
14:22:23.116804 IP ubuntu910.local.ssh > deb503.local.54424: P 1:81(80) ack
14:22:23.116844 IP deb503.local.54424 > ubuntu910.local.ssh: . ack 81 win 2
^C
10 packets captured
10 packets received by filter
0 packets dropped by kernel
Same as above, but write the output to a file with the tcpdump -w $filename command.
root@ubuntu910:~# tcpdump -w sshdump.tcpdump tcp port 22
tcpdump: listening on eth0, link-type EN10MB (Ethernet), capture size 96 bytes
^C
17 packets captured
17 packets received by filter
0 packets dropped by kernel
With tcpdump -r $filename the file created above can be displayed.
root@ubuntu910:~# tcpdump -r sshdump.tcpdump
Many more examples can be found in the manual page of tcpdump.
1. Install wireshark on your computer (not inside a virtual machine).
2. Start a ping between your computer and another computer.
3. Start sniffing the network.
4. Display only the ping echo's in the top pane using a filter.
5. Now ping to a name (like www.linux-training.be) and try to sniff the DNS query and response. Which DNS server was used ? Was it a tcp or udp query and response ?
6. Find an amateur/hobby/club website that features a login prompt. Attempt to login with user 'paul' and password 'hunter2' while your sniffer is running. Now find this information in the sniffer.
1. Install wireshark on your computer (not inside a virtual machine).
Debian/Ubuntu: aptitude install wireshark
Red Hat/Mandriva/Fedora: yum install wireshark
2. Start a ping between your computer and another computer.
ping $ip_address
3. Start sniffing the network.
(sudo) wireshark
select an interface (probably eth0)
4. Display only the ping echo's in the top pane using a filter.
type 'icmp' (without quotes) in the filter box, and then click 'apply'
5. Now ping to a name (like www.linux-training.be) and try to sniff the DNS query and response. Which DNS server was used ? Was it a tcp or udp query and response ?
First start the sniffer.
Enter 'dns' in the filter box and click apply.
root@ubuntu910:~# ping www.linux-training.be
PING www.linux-training.be (88.151.243.8) 56(84) bytes of data.
64 bytes from fosfor.openminds.be (88.151.243.8): icmp_seq=1 ttl=58 time=14.9 ms
64 bytes from fosfor.openminds.be (88.151.243.8): icmp_seq=2 ttl=58 time=16.0 ms
^C
--- www.linux-training.be ping statistics ---
2 packets transmitted, 2 received, 0% packet loss, time 1002ms
rtt min/avg/max/mdev = 14.984/15.539/16.095/0.569 ms
The wireshark screen should look something like this.
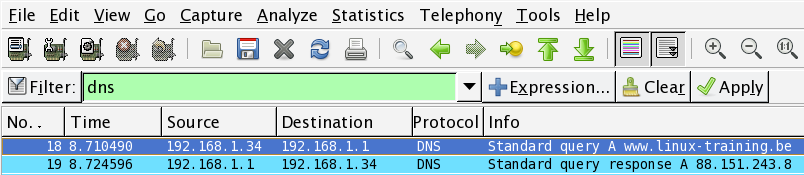
The details in wireshark will say the DNS query was inside a udp packet.
6. Find an amateur/hobby/club website that features a login prompt. Attempt to login with user 'paul' and password 'hunter2' while your sniffer is running. Now find this information in the sniffer.