Table of Contents
Monitoring is the process of obtaining information about the utilization of memory, cpu, bandwidth and storage. You should start monitoring your system as soon as possible, to be able to create a baseline. Make sure that you get to know your system! This baseline is important because it allows you to see a steady or sudden growth in resource utilization and likewise steady (or sudden) decline in resource availability. It will allow you to plan for scaling up or scaling out.
Let us look at some tools that go beyond ps fax, df -h, free -om and du -sh.
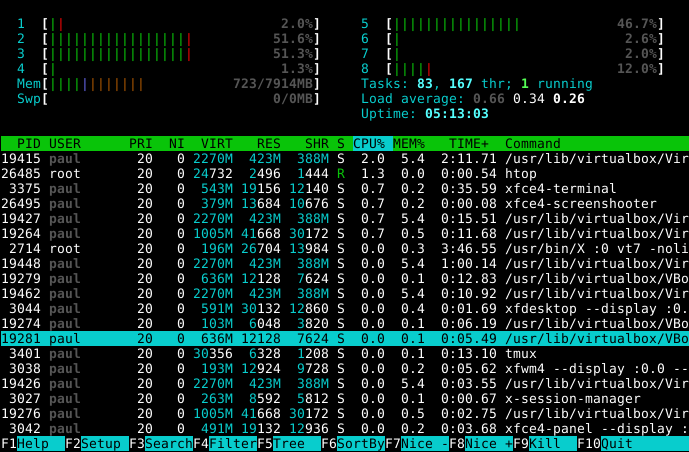
To start monitoring, you can use top. This tool will monitor ram memory, cpu and swap. Top will automatically refresh. Inside top you can use many commands, like k to kill processes, or t and m to toggle displaying task and memory information, or the number 1 to have one line per cpu, or one summary line for all cpu's.
top - 12:23:16 up 2 days,  4:01, 2 users, load average: 0.00, 0.00, 0.00
Tasks:  61 total,   1 running,  60 sleeping,   0 stopped,   0 zombie
Cpu(s):  0.3% us,  0.5% sy, 0.0% ni, 98.9% id, 0.2% wa, 0.0% hi, 0.0% si
Mem:    255972k total,   240952k used,    15020k free,    59024k buffers
Swap:   524280k total,      144k used,   524136k free,   112356k cached

PID USER      PR  NI  VIRT  RES  SHR S %CPU %MEM    TIME+  COMMAND
 1 root      16   0  2816  560  480 S  0.0  0.2   0:00.91 init
 2 root      34  19     0    0    0 S  0.0  0.0   0:00.01 ksoftirqd/0
 3 root       5 -10     0    0    0 S  0.0  0.0   0:00.57 events/0
 4 root       5 -10     0    0    0 S  0.0  0.0   0:00.00 khelper
 5 root      15 -10     0    0    0 S  0.0  0.0   0:00.00 kacpid
16 root       5 -10     0    0    0 S  0.0  0.0   0:00.08 kblockd/0
26 root      15   0     0    0    0 S  0.0  0.0   0:02.86 pdflush
...
You can customize top to display the columns of your choice, or to display only the processes that you find interesting.
[paul@RHELv4u3 ~]$ top p 3456 p 8732 p 9654
The free command is common on Linux to monitor free memory. You can use free to display information every x seconds, but the output is not ideal.
[paul@RHELv4u3 gen]$ free -om -s 10
total       used       free     shared    buffers     cached
Mem:        249        222         27          0         50        109
Swap:       511          0        511

total       used       free     shared    buffers     cached
Mem:        249        222         27          0         50        109
Swap:       511          0        511

[paul@RHELv4u3 gen]$
It might be more interesting to combine free with the watch program. This program can run commands with a delay, and can highlight changes (with the -d switch).
[paul@RHELv4u3 ~]$ watch -d -n 3 free -om
...
Every 3.0s: free -om                             Sat Jan 27 12:13:03 2007

total       used       free     shared    buffers     cached
Mem:           249        230         19          0         56        109
Swap:          511          0        511
To monitor CPU, disk and memory statistics in one line there is vmstat. The screenshot below shows vmstat running every two seconds 100 times (or until the Ctrl-C). Below the r, you see the number of processes waiting for the CPU, sleeping processes go below b. Swap usage (swpd) stayed constant at 144 kilobytes, free memory dropped from 16.7MB to 12.9MB. See man vmstat for the rest.
[paul@RHELv4u3 ~]$ vmstat 2 100
procs ----------memory--------- --swap-- ---io--- --system-- ---cpu----
r  b  swpd   free   buff  cache  si  so  bi   bo   in    cs us sy id wa
0  0   144  16708  58212 111612   0   0   3    4   75    62  0  1 99  0
0  0   144  16708  58212 111612   0   0   0    0  976    22  0  0 100 0
0  0   144  16708  58212 111612   0   0   0    0  958    14  0  1 99  0
1  0   144  16528  58212 111612   0   0   0   18 1432  7417  1 32 66  0
1  0   144  16468  58212 111612   0   0   0    0 2910 20048  4 95  1  0
1  0   144  16408  58212 111612   0   0   0    0 3210 19509  4 97  0  0
1  0   144  15568  58816 111612   0   0 300 1632 2423 10189  2 62  0 36
0  1   144  13648  60324 111612   0   0 754    0 1910  2843  1 27  0 72
0  0   144  12928  60948 111612   0   0 312  418 1346  1258  0 14 57 29
0  0   144  12928  60948 111612   0   0   0    0  977    19  0  0 100 0
0  0   144  12988  60948 111612   0   0   0    0  977    15  0  0 100 0
0  0   144  12988  60948 111612   0   0   0    0  978    18  0  0 100 0

[paul@RHELv4u3 ~]$
The iostat tool can display disk and cpu statistics. The -d switch below makes iostat only display disk information (500 times every two seconds). The first block displays statistics since the last reboot.
[paul@RHELv4u3 ~]$ iostat -d 2 500
Linux 2.6.9-34.EL (RHELv4u3.localdomain)        01/27/2007

Device:         tps   Blk_read/s   Blk_wrtn/s   Blk_read   Blk_wrtn
hdc            0.00         0.01         0.00       1080          0
sda            0.52         5.07         7.78     941798    1445148
sda1           0.00         0.01         0.00        968          4
sda2           1.13         5.06         7.78     939862    1445144
dm-0           1.13         5.05         7.77     939034    1444856
dm-1           0.00         0.00         0.00        360        288

Device:         tps   Blk_read/s   Blk_wrtn/s   Blk_read   Blk_wrtn
hdc            0.00         0.00         0.00          0          0
sda            0.00         0.00         0.00          0          0
sda1           0.00         0.00         0.00          0          0
sda2           0.00         0.00         0.00          0          0
dm-0           0.00         0.00         0.00          0          0
dm-1           0.00         0.00         0.00          0          0
...
[paul@RHELv4u3 ~]$
You can have more statistics using iostat -d -x, or display only cpu statistics with iostat -c.
[paul@RHELv4u3 ~]$ iostat -c 5 500
Linux 2.6.9-34.EL (RHELv4u3.localdomain)        01/27/2007

avg-cpu:  %user   %nice    %sys %iowait   %idle
0.31    0.02    0.52    0.23   98.92

avg-cpu:  %user   %nice    %sys %iowait   %idle
0.62    0.00   52.16   47.23    0.00

avg-cpu:  %user   %nice    %sys %iowait   %idle
2.92    0.00   36.95   60.13    0.00

avg-cpu:  %user   %nice    %sys %iowait   %idle
0.63    0.00   36.63   62.32    0.42

avg-cpu:  %user   %nice    %sys %iowait   %idle
0.00    0.00    0.20    0.20   99.59

	[paul@RHELv4u3 ~]$
On multi-processor machines, mpstat can display statistics for all, or for a selected cpu.
paul@laika:~$ mpstat -P ALL
Linux 2.6.20-3-generic (laika)  02/09/2007

CPU %user  %nice   %sys %iowait   %irq   %soft  %steal   %idle   intr/s
all  1.77   0.03   1.37    1.03   0.02    0.39    0.00   95.40  1304.91
  0  1.73   0.02   1.47    1.93   0.04    0.77    0.00   94.04  1304.91
  1  1.81   0.03   1.27    0.13   0.00    0.00    0.00   96.76     0.00
paul@laika:~$
The sadc tool writes system utilization data to /var/log/sa/sa??, where ?? is replaced with the current day of the month. By default, cron runs the sal script every 10 minutes, the sal script runs sadc for one second. Just before midnight every day, cron runs the sa2 script, which in turn invokes sar. The sar tool will read the daily data generated by sadc and put it in /var/log/sa/sar??. These sar reports contain a lot of statistics.
You can also use sar to display a portion of the statistics that were gathered. Like this example for cpu statistics.
[paul@RHELv4u3 sa]$ sar -u | head
Linux 2.6.9-34.EL (RHELv4u3.localdomain)        01/27/2007

12:00:01 AM       CPU     %user     %nice   %system   %iowait    %idle
12:10:01 AM       all      0.48      0.01      0.60      0.04    98.87
12:20:01 AM       all      0.49      0.01      0.60      0.06    98.84
12:30:01 AM       all      0.49      0.01      0.64      0.25    98.62
12:40:02 AM       all      0.44      0.01      0.62      0.07    98.86
12:50:01 AM       all      0.42      0.01      0.60      0.10    98.87
01:00:01 AM       all      0.47      0.01      0.65      0.08    98.80
01:10:01 AM       all      0.45      0.01      0.68      0.08    98.78
[paul@RHELv4u3 sa]$
There are other useful sar options, like sar -I PROC to display interrupt activity per interrupt and per CPU, or sar -r for memory related statistics. Check the manual page of sar for more.
The ntop tool is not present in default Red Hat installs. Once run, it will generate a very extensive analysis of network traffic in html on http://localhost:3000 .
The iftop tool will display bandwidth by socket statistics for a specific network device. Not available on default Red Hat servers.
1.91Mb        3.81Mb         5.72Mb        7.63Mb   9.54Mb
--------------|-------------|--------------|-------------|--------|----
laika.local        => barry                      4.94Kb  6.65Kb  69.9Kb
                   <=                            7.41Kb  16.4Kb   766Kb
laika.local        => ik-in-f19.google.com          0b   1.58Kb  14.4Kb
                   <=                               0b    292b   41.0Kb
laika.local        => ik-in-f99.google.com          0b     83b   4.01Kb
                   <=                               0b     83b   39.8Kb
laika.local        => ug-in-f189.google.com         0b     42b    664b
                   <=                               0b     42b    406b
laika.local        => 10.0.0.138                    0b      0b    149b
                   <=                               0b      0b    256b
laika.local        => 224.0.0.251                   0b      0b     86b
                   <=                               0b      0b      0b
laika.local        => ik-in-f83.google.com          0b      0b     39b
<= 0b 0b 21bUse iptraf for a colourful display of ip traffic over the network cards.
[root@centos65 ~]# iptraf
[root@centos65 ~]# iptraf -i eth0